Uptime Analytics
The analytics dashboard aggregates heartbeats into availability percentages, latency trends, and status history.Overview
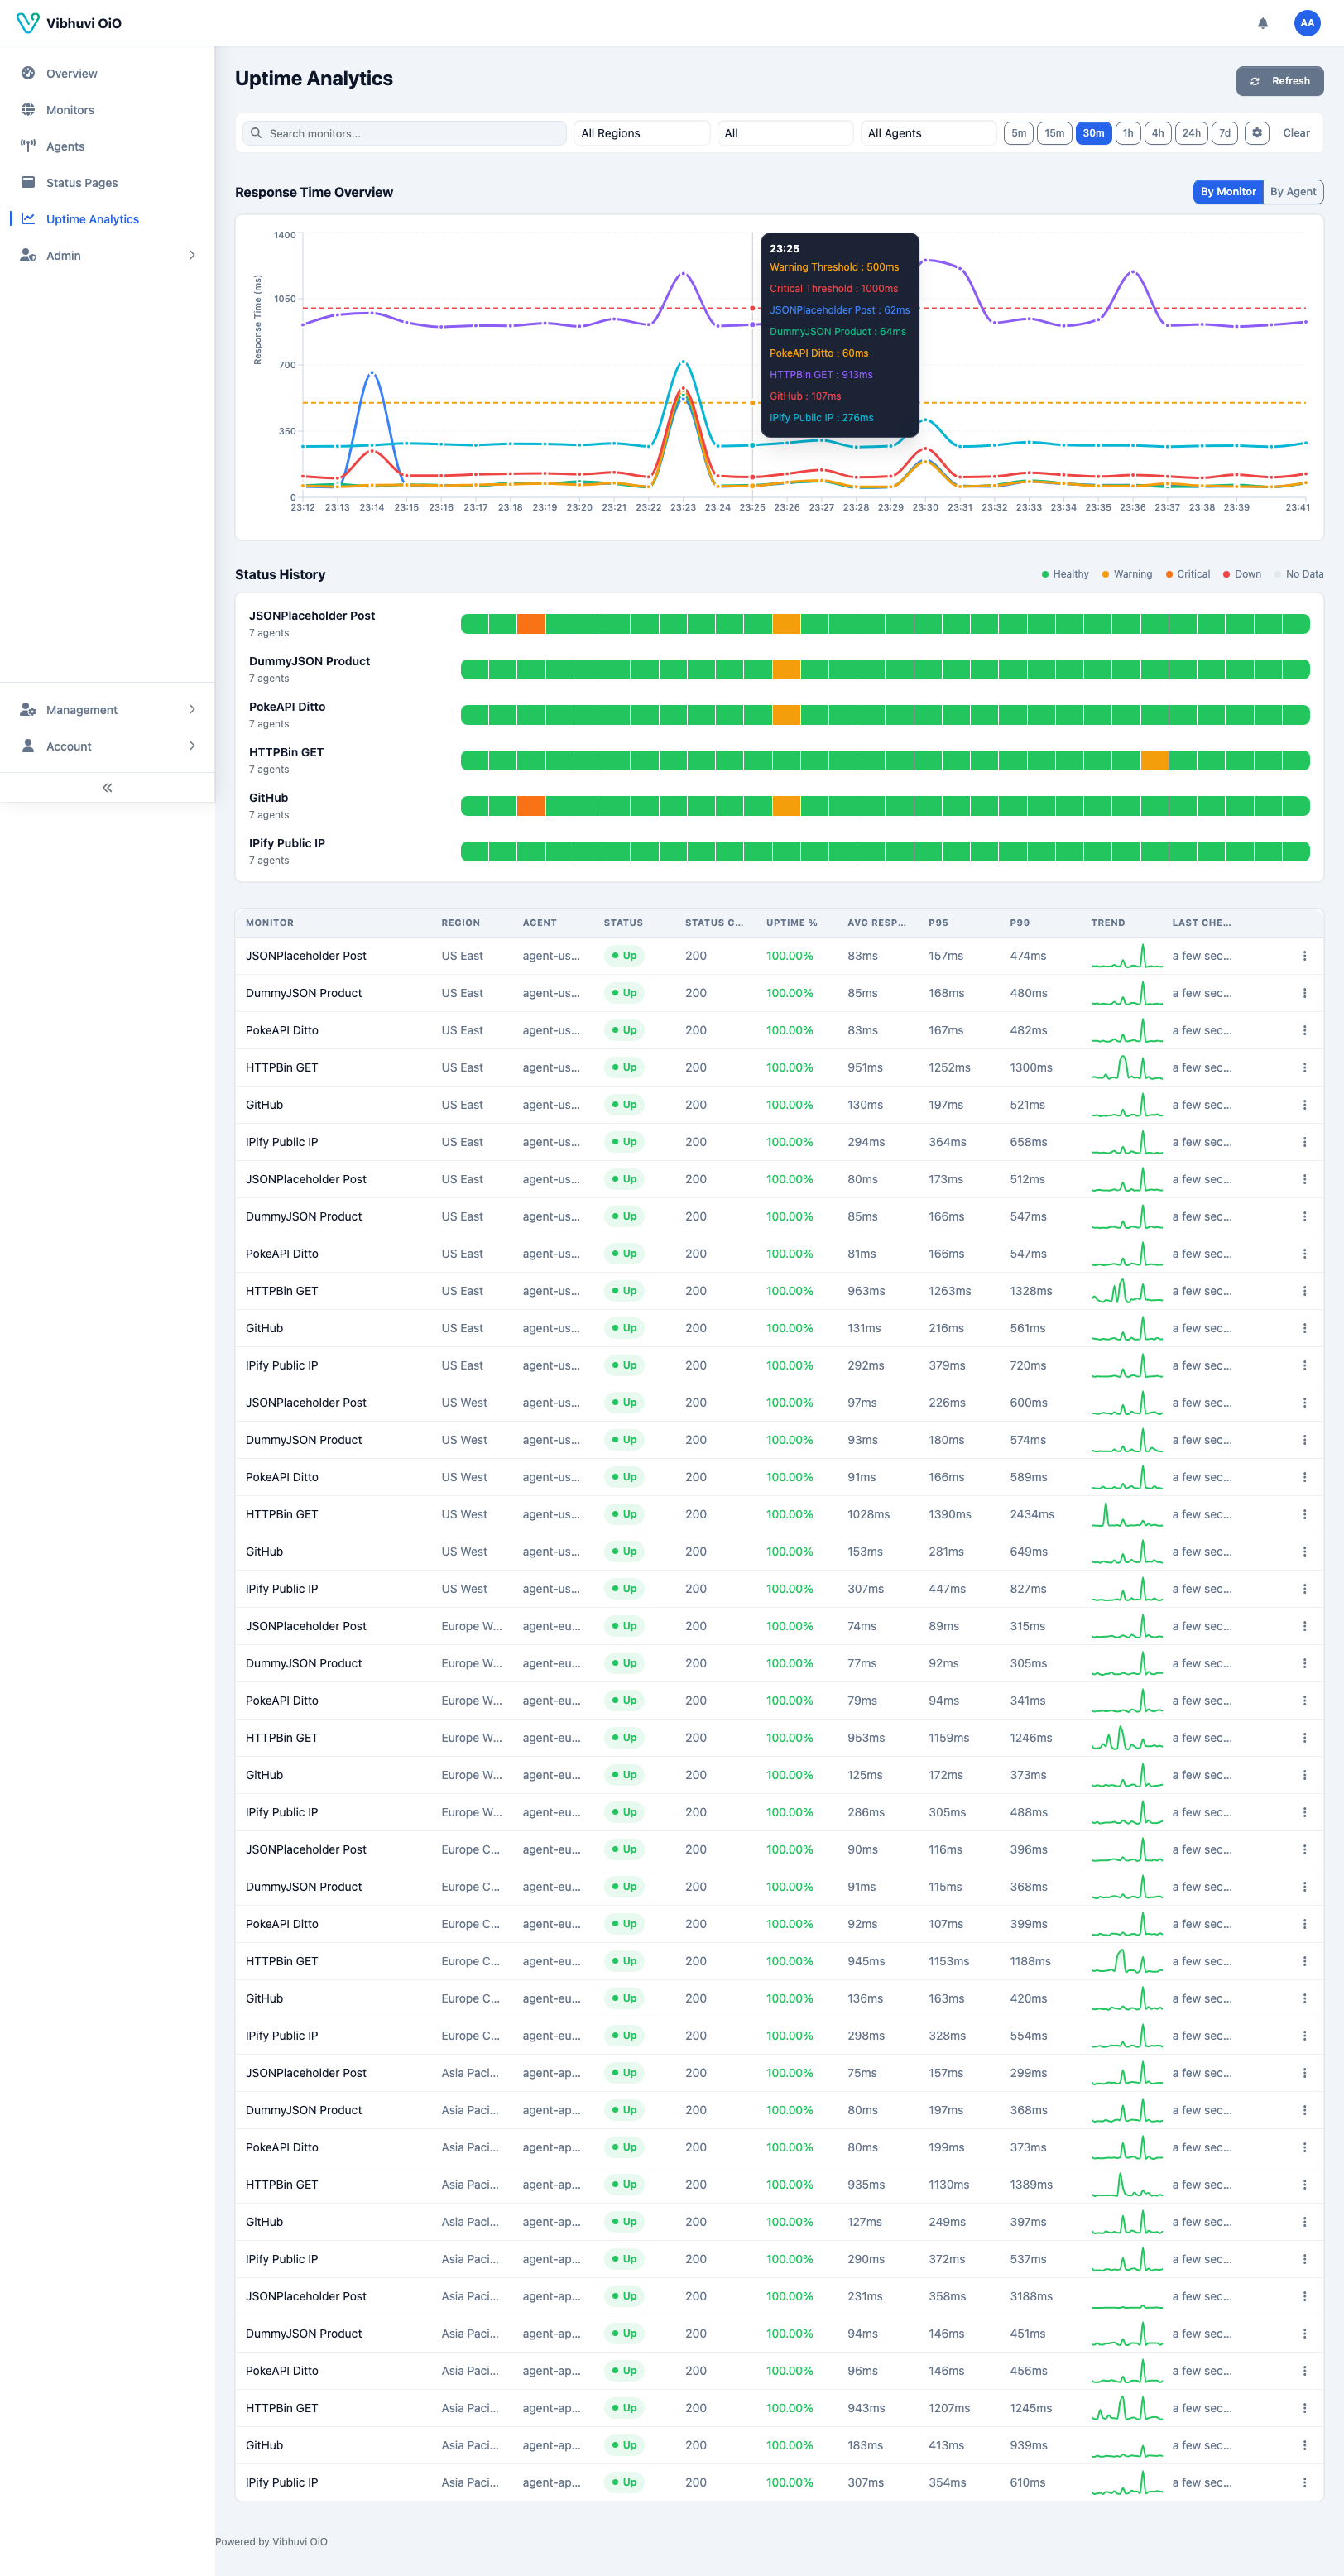 From the analytics page you can see:
- Overall uptime percentage
- Average and p95 response times
- Status history bars per monitor
- Region and datacenter rollups
Querying Heartbeats Directly
You can query the PostgreSQL database for raw heartbeats:
SELECT monitor_id, agent_id, success, response_time_ms, executed_at
FROM api_heartbeats
ORDER BY executed_at DESC
LIMIT 20;