Grafana Dashboard
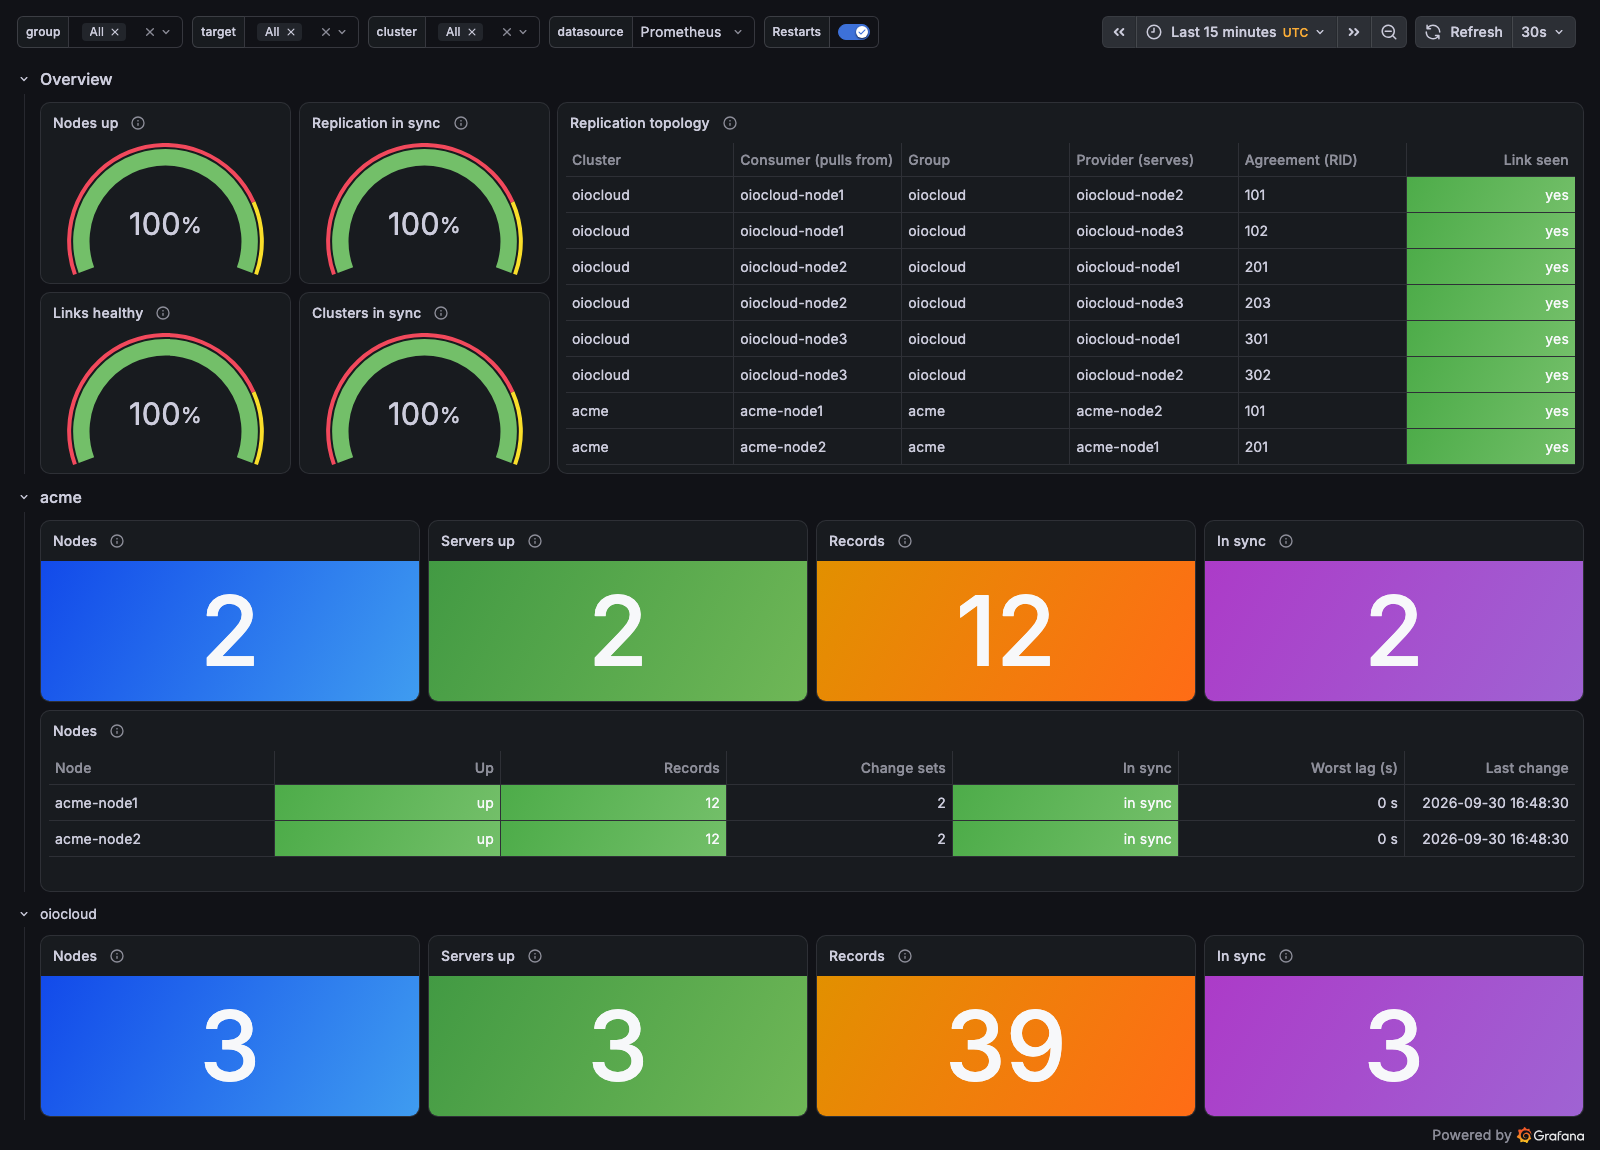
Required: a cluster label
The dashboard groups every panel by a cluster label that the exporter does not emit. Prometheus attaches it, one per exporter instance:
scrape_configs:
  - job_name: openldap
    scrape_interval: 30s
    static_configs:
      - targets: ['openldap-exporter:9330']
        labels: { cluster: prod }
      - targets: ['openldap-exporter-alt:9331']
        labels: { cluster: staging }
cluster, group and target variables come up empty and most panels show no data.
Import
Download dashboards/openldap.json, then in Grafana Dashboards → New → Import. Grafana asks which Prometheus to use.Variables
| variable | meaning |
|---|---|
cluster | one per exporter instance |
group | the nodes that must agree |
target | a single server |
Reading a replication problem
Each step isolates the cause, so work down in order:- 1 Nodes up — is anything answering.
- 2 Links healthy — did the providers observe their consumers connect.
-
3
In sync — do the
contextCSNvalues agree. - 4 Replication lag by sid — how far behind, per sid.
- 5 Consumer links seen by providers — which node's link is dead while its own socket still looks healthy.
- 6 Records / Change sets / Last change — did the data actually arrive.
Last change is the newest contextCSN timestamp on a node. Identical values across a cluster mean the nodes converged on the same newest change; a node that has fallen behind shows an older timestamp. It is the strongest convergence signal on the page, because it comes from the data rather than from replication's own bookkeeping.
Empty when healthy
| panel | why |
|---|---|
| Sids missing per target | only lists sids a node is missing |
| TLS certificate days remaining | needs TLS enabled on the target |
One gotcha
Two providers that bootstrapped independently each hold a contextCSN for their own sid only. Until each accepts one change from the other's sid their CSN sets differ, and the sync check reports the pair as not converged — although both are healthy. One write against each node closes it.